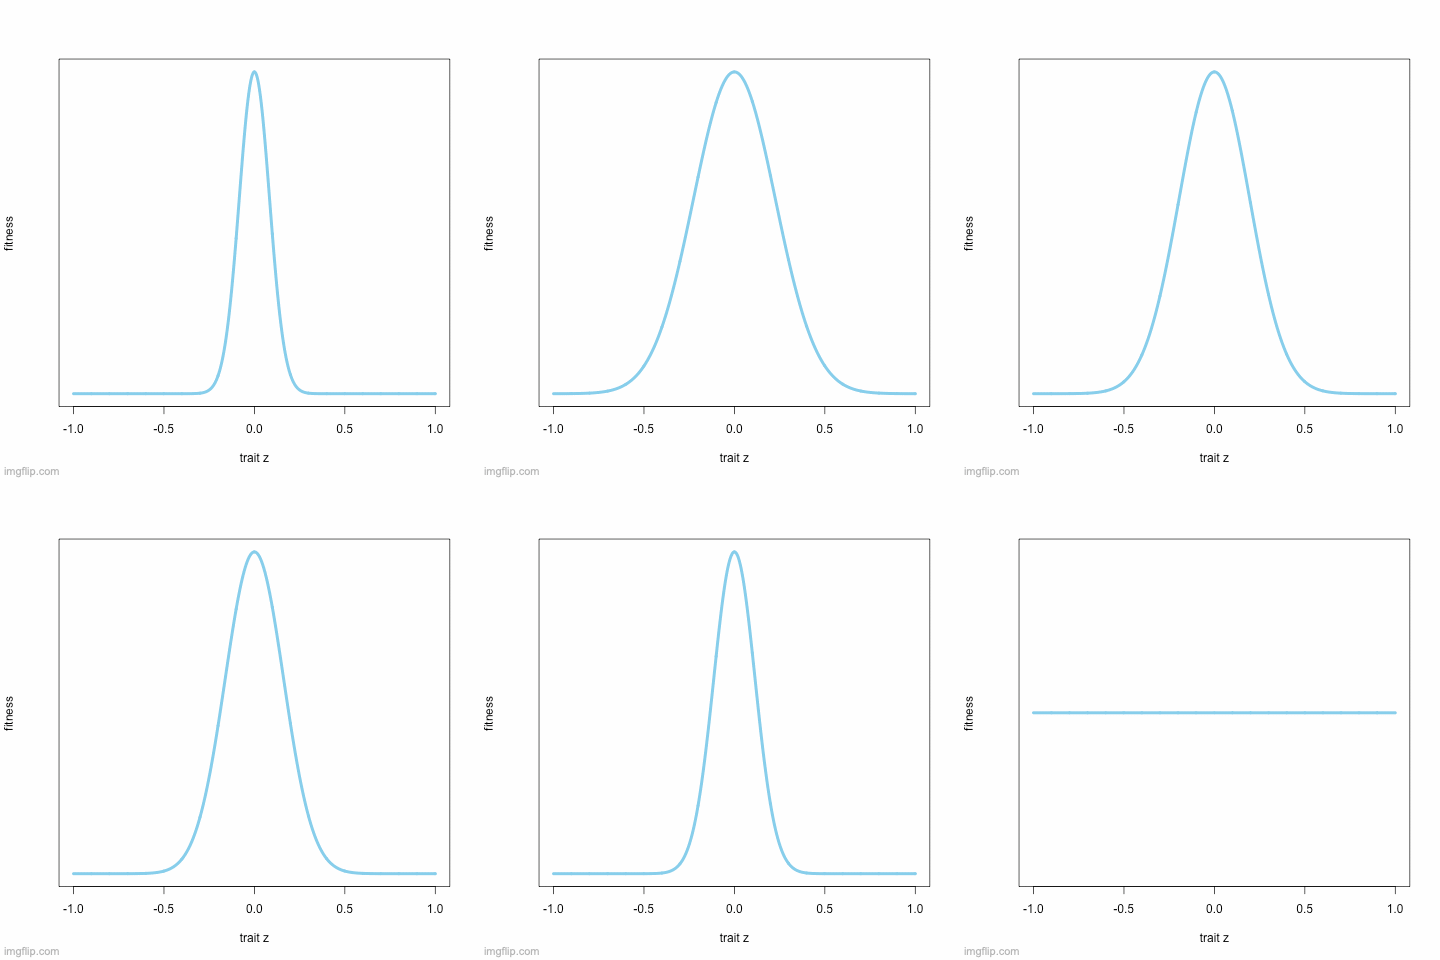
An animation of how a Gaussian fitness function changes with increasing w (width of the fitness function, which indicates the strength of stabilizing selection)
# library
library(animation)
oopt = ani.options(interval = .07)

# to visualize the fitness function and its dependency on w
fit <- function(z,w2){
  W <- exp( (-z^2) / (2*w2) )
}

z_range <- seq(-1,1,.001)
w_range <- seq(0,5,.08)
W_record <- array(NA,dim=c(length(z_range),length(w_range)))

for(j in 1:length(w_range)){
  for(i in 1:length(z_range)){
    W_record[i,j] <- fit(z_range[i],w_range[j])
  }
}

# plot
plot(z_range,w_record[,1],type="l",lwd=4,col="skyblue",ylab="fitness",xlab = "trait z")

for(i in 2:length(w_range)){
  print(i)
  dev.hold()
  plot(z_range,w_record[,i],type="l",lwd=4,col="skyblue",ylab="fitness",xlab="trait z")
  ani.pause()
}
