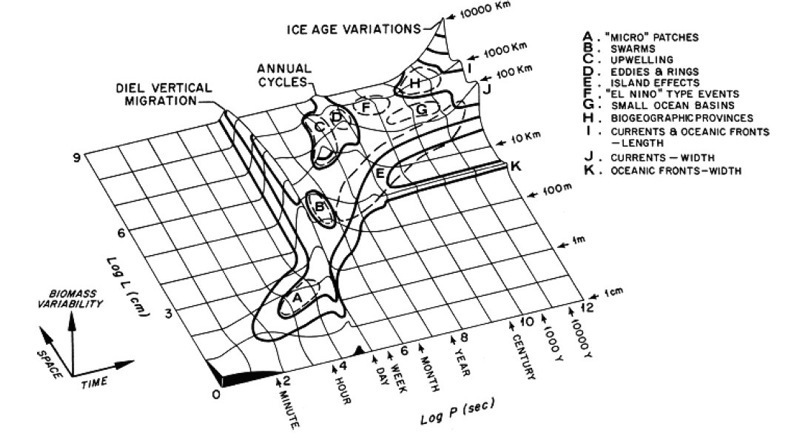
I have previous experience with John Steele bringing brilliant mathematical techniques and patterns to a broader ecological audience. Now, thanks to the Resilience Science blog and their report of a very fun article, I have come across another stunning example. Steele edited a 1978 volume of the Proceedings of the NATO Conference on Marine Biology, which includes a chapter by L.R. Haury, J.A. McGowan, and P.H. Wiebe titled ‘Patterns and processes in the time-space scales of plankton distributions.’ They bring the Stommel diagram metaphorically to life by linking the two dimensions of space and time with a third dimension of biomass variability (the z-axis in the figure above).
organisms have aggregated, patchy distributions of abundance on a wide variety of space and time scales…It has been more difficult to observe in the pelagic realm simply becåuse we cannot see into the ocean
-Haury et al.
A brilliant example of using the dimensions humans can see to understand processes we cannot observe.
Related Posts
 Animated plot in R
- Interpolation of discrete data in QGIS
- stiffness and ordinary differential equation solving
- Well put Mathematica Documentation. Well put.
- Calculating the spatial gradient for georeferenced trait values
- “In the automobile industry, a discontinuous second derivative is known as a dent”